Reporting & Tracking
Chapter 1
Data Tier
Rintagi, the renewable open source .NET code generator that embraces late-change-no-penalty, requires a blue-print to generate concise and pertinent reports. Each report is composed of the following tiers:
1.  Data Tier: Logical representation of the tables and columns.
2.  Client Tier: Layout and format of each output field.
3.  Rule Tier: Business rules to extract the appropriate information
               from the data tier.
Because Rintagi periodically regenerates itself, all of its functionality can be found and reused in the creation of custom reports for development and administrative purposes. Rintagi provides built-in screens for capturing and maintaining information about the tables and columns in the physical database.
Rintagi is not a data modeling tool but it can create and modify database table schema definitions. It shows the database tables selected to be used in the application, as well as, the basic schema information for each table. Indices are set up directly in the physical database. Rintagi recommends virtual foreign keys so that no physical foreign key is required.
Each record represents a physical table in the designated database. The table name is the same as the physical table name. The column names are the same as the physical column names. For details refer to Volume 2, Chapter 1– Data Entry & Management.
Chapter 2
Report Generator
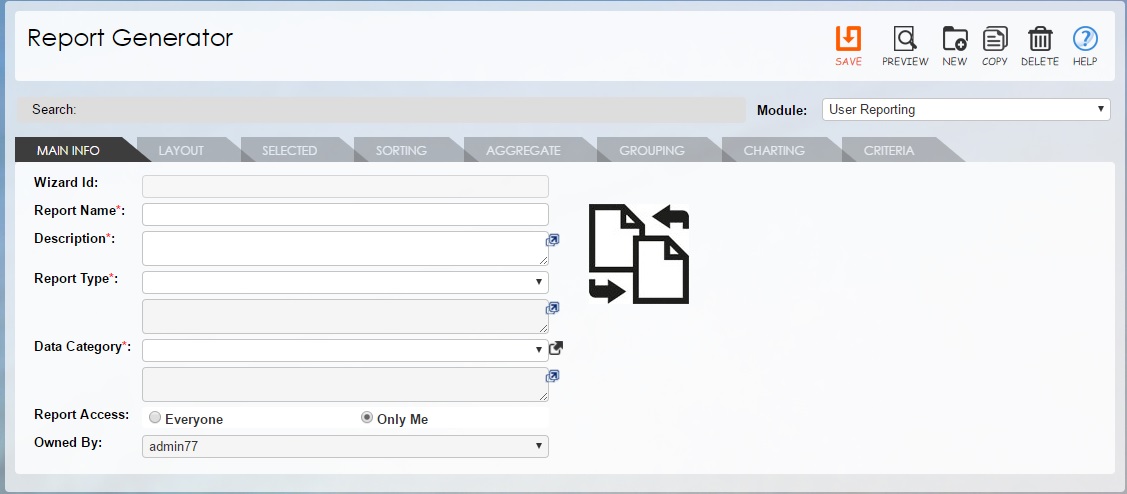
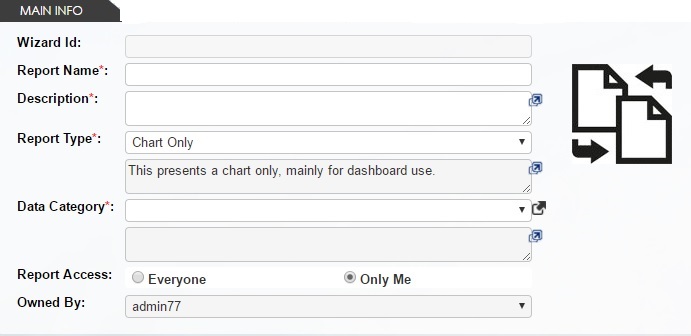
Business users will find that the Report Generator creates reports, documents, charts or dashboards easily. To make the best use of Rintagi, it is recommended that the Report Generator is used to create a basic report that can then be enhanced by technical people.
The Report Generator is organized into many tab folders, and depending on the selection of report type, the available tabs may change.
Command: Client Tier -> Report -> Report Generator
Report Generator Types
The types of reports available in the Report Generator are:
1.  Dashboard Gauge Only
2.  Graphical Chart Only
4.  Summary Table Report with Chart
More reporting types are available at the advanced level and will be described in a later chapter.
Dashboard Gauge
Dashboard gauge is generally used to show the status of a numeric indicator. It usually has a range and the needle value should read within that range. For example:
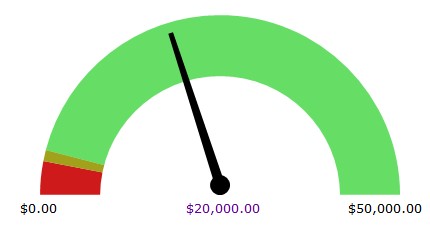
The four tabs of information required to produce a gauge are:
1.  Main
2.  Selected
3.  Report Type
4.  Criteria
Main Info
| Schema Characteristics | Description |
|---|---|
| Report Name | The name that uniquely identifies this wizard-generated report. |
| Description | The description of this wizard-generated report. |
| Owned By | This wizard-generated report is created and owned by this user. The field is read-only and populated automatically by the system of the login user. |
| Report Type | The report type for this wizard-generated report. When selected, the tab folders may change to allow the appropriate data to be entered. |
| Data Category | The data category for this wizard-generated report. When selected, the picture on the right will reflect a sample of the expected results. |
Selected Info
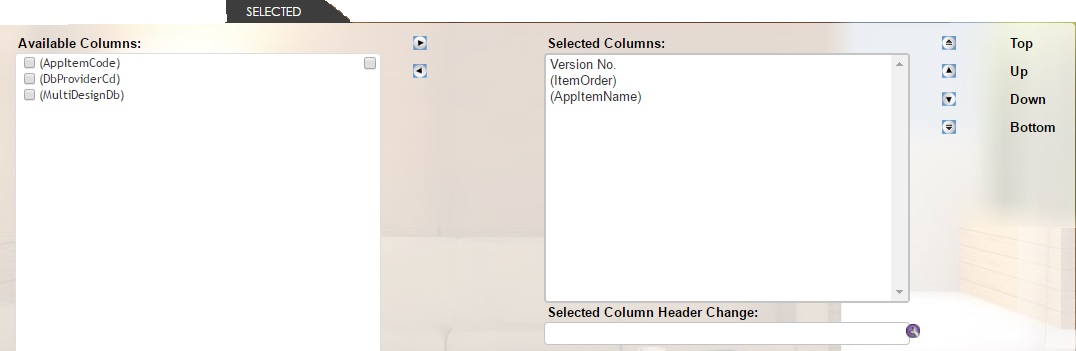
All types of reports require this “Selected” tab folder. Although many columns can be selected from any available table, ultimately only one column can be selected and it should be numeric to be meaningful. If the available column has a corresponding screen with a label, it will be shown; otherwise, the column name as it appears in the database will be enclosed in parentheses here. When a selected column is highlighted, the label can be changed in the “Selected Column Header Change” slot.
Dashboard Info
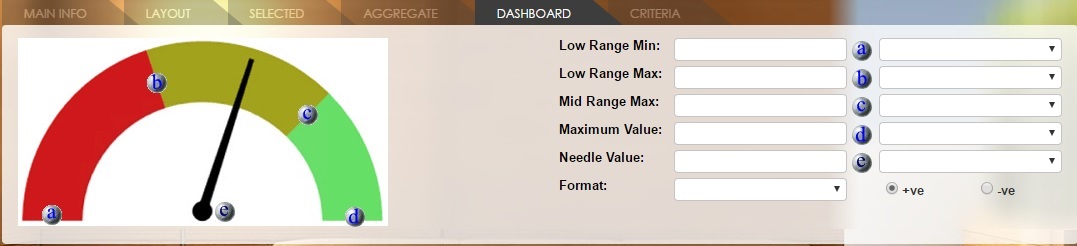
| Schema Characteristics | Description |
|---|---|
| Low Range Min | The minimum value for the gauge. The Needle value should not be less than this at any time. |
| Maximum Value | The maximum value for the gauge. The Needle value should not be greater than this at any time. |
| Low Range Max | The low range maximum value for the gauge. This limits the red area of the gauge. |
| Mid Range Max | The mid range maximum value for the gauge. This limits the amber area of the gauge. |
| Needle Value | Select one of the numeric columns selected from previous tab folder. The value of this selected column will be the needle value. |
| Format | The format type for all the gauge values above. |
Criteria Info
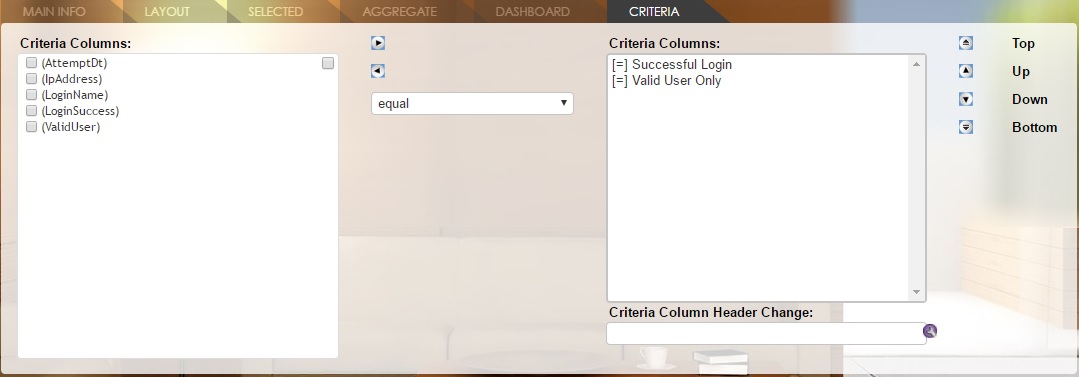
All types of reports require this “Criteria” tab folder. Select at least one criteria column. If the selected column is a date data type, a calendar will be displayed; otherwise a textbox will be displayed for the criteria value. More advanced display types are available in the advanced sections described in later chapters. Similar to the “Selected” tab folder, the label for each criteria column can be changed. Unlike the “Selected” tab folder, each available column can be selected multiple times. Many criteria can be selected and will be displayed in horizontal alignment although by using the advanced settings they can be arranged in nested tables also.
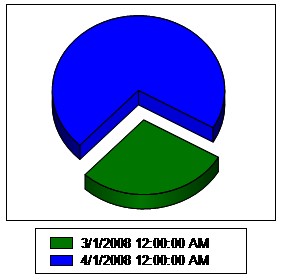
Graphical Chart Only
This is most applicable when only a chart is needed. For example:
There are four tabs required to produce a chart. The “Main” and “Criteria” tab folders are the same as previously described.
Selected Info
This tab is similar to the “Selected” tab folder for gauges. Although many columns can be selected from any available table, ultimately only two or three columns can be selected and they should be either numeric or date-sensitive to be meaningful.
Charting
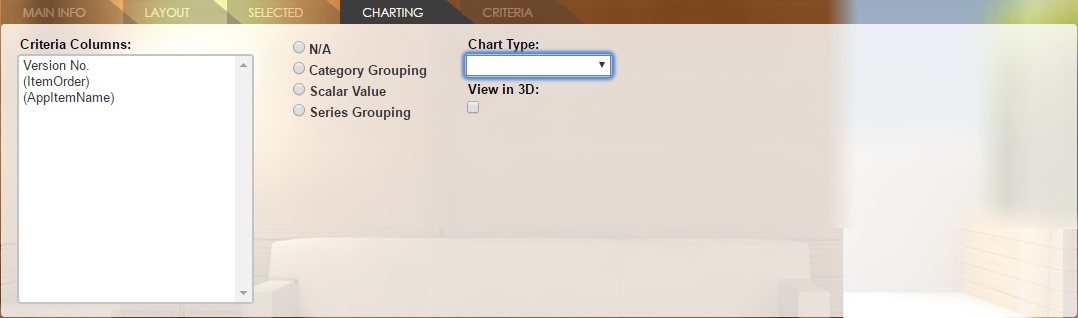
The available chart types are:
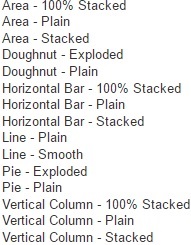
After selecting the chart type, a sample image will appear on the right in two-dimensions (2D). If “View in 3D” is checked, the sample image on the right will change to a 3D image.
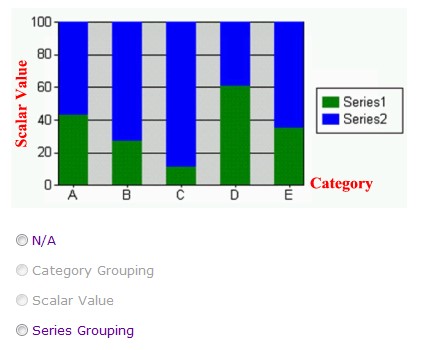
Highlight a column to be the x-axis (for horizontal bar graphs the x-axis becomes the y-axis) and check “Category Grouping”. This column should be date sensitive or numeric to be meaningful. A “[C]” will then prefix the column name. Highlight another column to be the y-axis (for horizontal bar graphs the x-axis becomes the y-axis) and check “Scalar Value”. This column should be numeric in data type. A “[V]” will then prefix the column name. These two entries are mandatory for any chart.
If one more column is required in a series (below), highlight the column to be the z-axis and check “Series Grouping”. This column should contain numeric data. An “[S]” will then prefix the column name.
Series Charting:
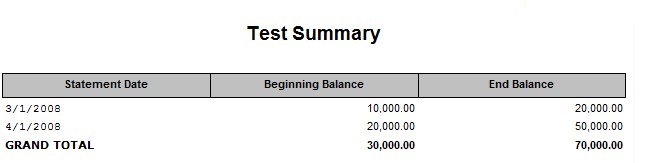
Summary Table Report
Aside from grouping and sorting, a summary table offers aggregates such as Count, Sum, Average, Largest, and Smallest to be applied to numeric columns. Charting is optional. If any of the above aggregates has been applied, the description “Grand Total” will be displayed as default. This description can later be changed to desirable text in the advanced reporting section.
Eight tabs are required to produce a Summary Table. All tab folders are the same as previously described except for the “Aggregate” tab.
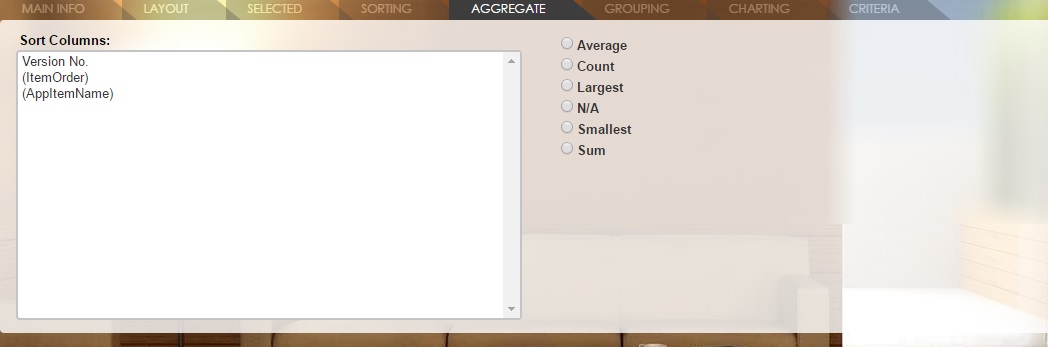
Select one of the selected columns and check Count, Sum, Average, Largest or Smallest as the aggregate function. The prefix “CNT”, “SUM”, “AVG”, “MAX”, or “MIN” will appear in front of the column, as appropriate. This aggregate will act upon a grouping level and on the grand total level.
Chapter 3
Client Tier
Rintagi reporting can be divided into four categories:
1.  Crystal Reporting – can be viewed on-line as HTML, printed to a server side
                        printer or exported to a tab-delimited file (.txt), Excel
                        spreadsheet (.xls), Adobe Acrobat (.pdf)
                        and Microsoft Word(.doc).
2.  Excel Reporting Only – most suitable for displaying large numbers of columns.
3.  Excel Document Merging
4.  Global Criteria – Not a report. A set of criteria that affects all screens as
                      a hidden filter.
5.  Report Generator utilities as explained in previous chapters:
    a.  Dashboard Gauge,
    b.  RTF Document Merging,
    c.  TXT Document Merging,
    d.  SQL Reporting Service which covers Charts, Lists and Summary Tables.
Although Rintagi currently provides only the above reporting types, these reports can be extended as Rintagi regenerates and evolves. Rintagi supports each organization in having its own unique Rintagi to generate company-specific codes that run on that company’s architecture. Source code will be provided for that purpose. Report Generator automatically fills all basic Report Definition information. Business users will find most of their report needs met with these basic definitions. More sophisticated report types may require input directly from developers. Rintagi provides a multitude of design options.
Report Definition
In Report Definition there are five tab folders as follow:
1.  Main
2.  Fields
3.  Parameters
4.  Update
5.  Excel
Main Info
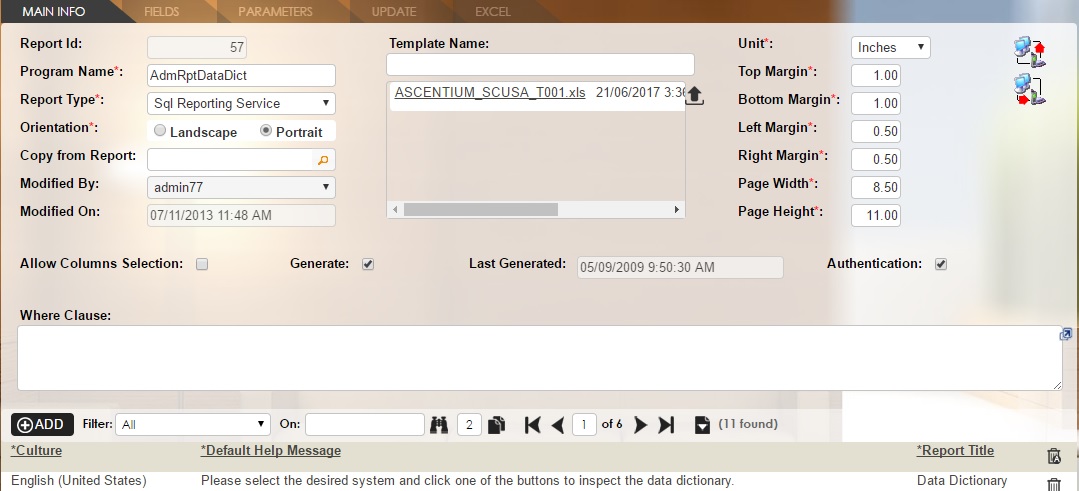
| Column | Description |
|---|---|
| Report Id | An internal identity uniquely representing this report. |
| Program Name | The unique Program Name (20 characters or less). This name should be preceded with two or three characters that identify the database to which belongs. |
| Report Type | The type of this report. If RTF/TXT document merging is selected a default Template Name becomes mandatory. |
| Orientation | Selects portrait or landscape layout for printed report. Not applicable to SQL Reporting as the page width and height will be specified separately. |
| Copy from Report | The report to copy the columns from, if desired. |
| Modified By | This report definition was last modified by this user. |
| Modified On | This report definition was last modified on this date and time. |
| Template Name | This .txt or .rtf template will be used for RTF/TXT document merging, if any. |
| Templates | The document templates available for merging. The latest version of the same name will be used. |
| Unit | The unit of measure for the margins, positions, etc. of this report. Only applicable to SQL Reporting. |
| Top Margin | The top margin of this report. Only applicable to SQL Reporting. |
| Bottom Margin | The bottom margin of this report. Only applicable to SQL Reporting. |
| Left Margin | The left margin of this report. Only applicable to SQL Reporting. |
| Right Margin | The right margin of this report. Only applicable to SQL Reporting. |
| Page Width | The page width of this report. Only applicable to SQL Reporting. |
| Page Height | The page height of this report. Only applicable to SQL Reporting. |
| Click here to obtain all of the Stored Procedures from the physical database. | |
| Click here to synchronize all of the Stored Procedures to the physical database immediately. | |
| Allow Column Selection | Check if columns can be deselected at run time. Relevant to RTF/TXT document merging only. |
| Generate | Uncheck this if no programs should be generated for this report at this time. |
| Last Generated | The Stored Procedures were last generated on this date. |
| Where Clause | Additional conditions to the Where clause in SQL, if applicable. |
| Culture | The culture for this cultural-specific report name. |
| Default Help Message | The message (with unlimited characters) to be displayed as a help message in the language specified. |
| Report Title | The title for this report (50 characters or less) in the language specified. |
Fields Info
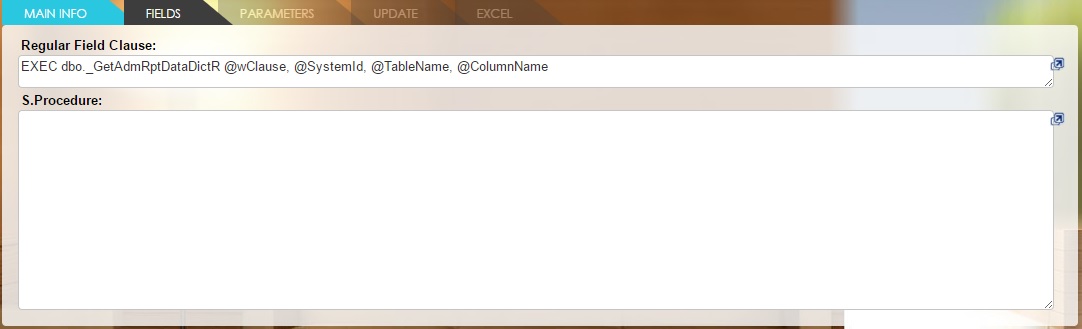
| Column | Description |
|---|---|
| Regular Field Clause | When left empty, this will be filled with a standard clause to call a pre-defined stored-procedure with a name starts with “_Get”, followed by the unique report name and an “R”. Developer may choose to overwrite this as long as it matches the name in the reporting Stored Procedures and the parameters are met. This should be adjusted accordingly upon adding or removing reporting criteria. |
| S. Procedure | This content will be executed as Stored Procedure (SQL) on the relevant database(s) when not empty. |
Parameters Info
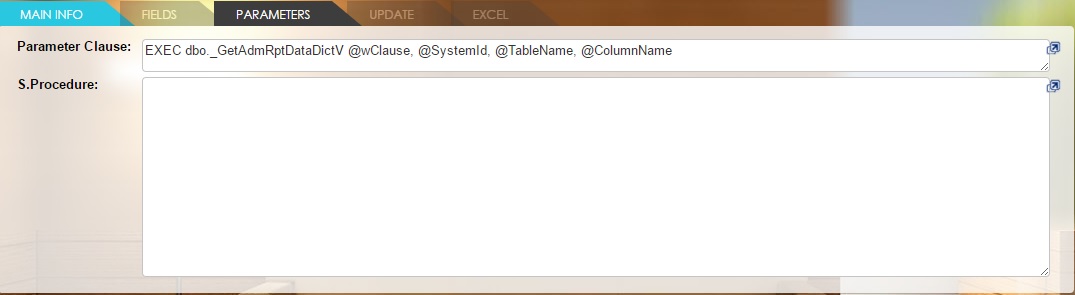
| Column | Description |
|---|---|
| Parameter Clause | This will be filled with a standard clause when not intended to provide data and at least one report column is a parameter. This is only relevant to SQL Reporting Service. |
| S. Procedure | When filled this content will be executed as Stored Procedure (SQL) on the relevant database(s). This is only relevant to SQL Reporting Service. |
Update Info
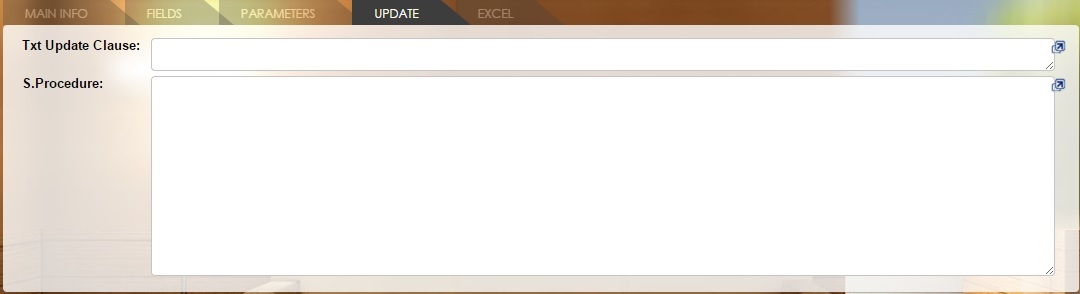
| Column | Description |
|---|---|
| Txt Update Clause | This will be filled with a standard clause when not intended to provide data and Template has a .txt extension. |
| S. Procedure | When filled this content will be executed as Stored Procedure (SQL) on the relevant database(s). |
Excel Info
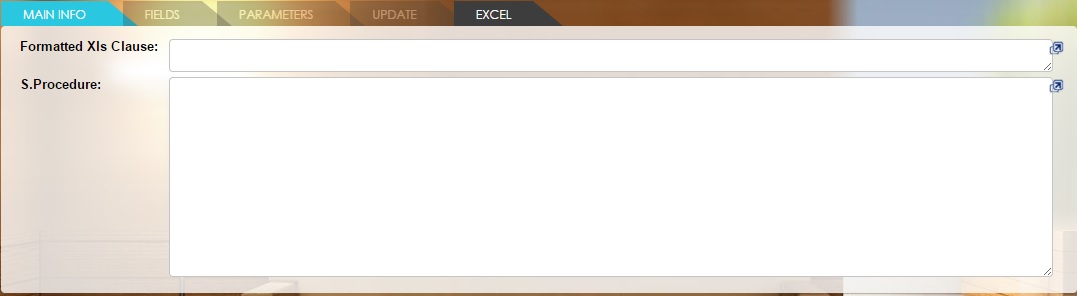
| Column | Description |
|---|---|
| Formatted Xls Clause | This will be filled with a standard clause when not intended to provide data and "To Excel Only" is checked. |
| S. Procedure | When filled this content will be executed as Stored Procedure (SQL) on the relevant database(s). |
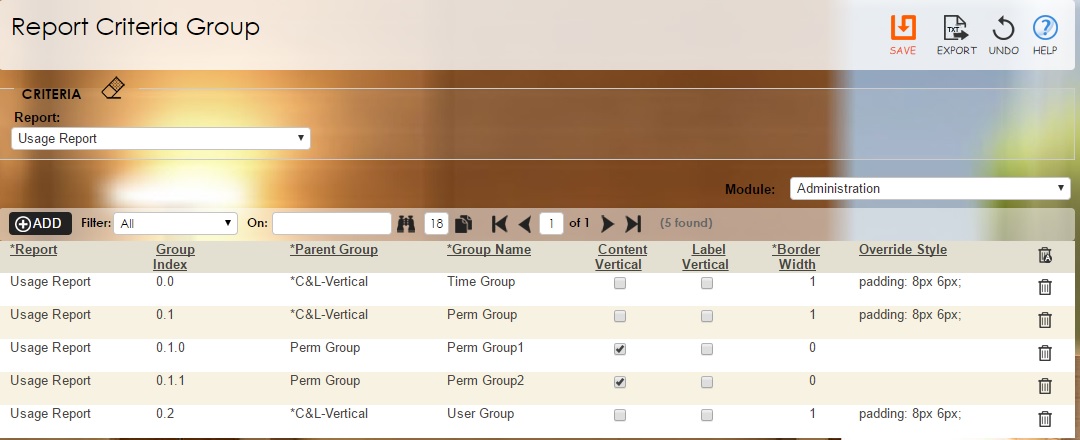
Report Criteria Group
The report criteria group option gives users the ability to set the apperance for a group of criteria.
Report Criteria
Many criteria can be added by the developer to facilitate flexible reporting. Rows can be filtered based on selected criteria. Contents of individual columns can be changed or filtered based on login user’s rights allowed within the report Stored Procedure in the Regular Field Clause.
Below is an example of multiple criteria for a report:
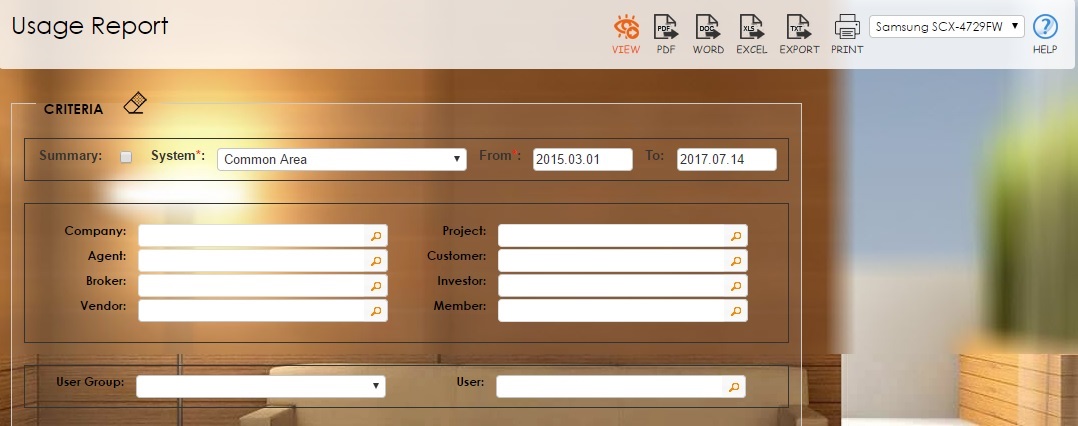
Most of the time users will change only one of many criteria offered each time a report is run; therefore, each time a user successfully runs a report, the criteria being used for that report by that user is memorized and Rintagi will reselect those last criteria when the same user runs the same report again.
To add report criteria, the following user interface can be used without coding. There are two tab folders of information required.
Main Info
Command: Client Tier -> Report -> Advanced Report -> Report Criteria
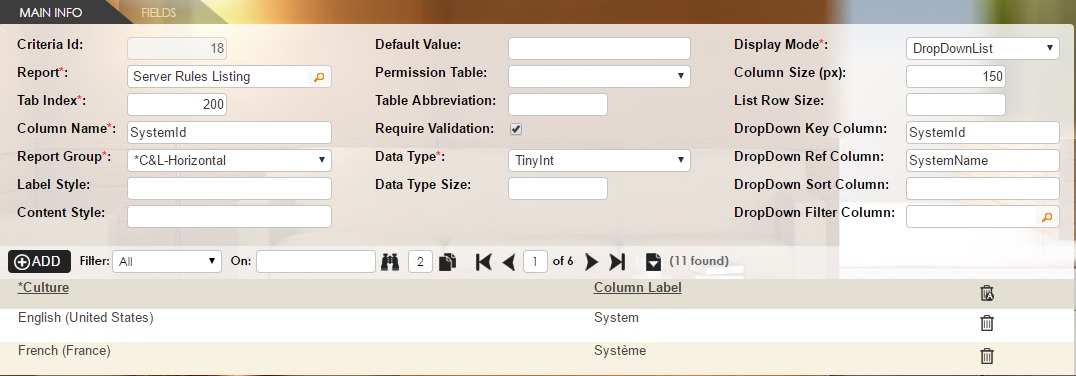
| Column | Description |
|---|---|
| Criteria Id | The internal ID that uniquely identifies this report criteria column. |
| Report | The report that this criteria applies to. |
| Tab Index | The unique integer for the order of appearance. When a number is entered, all tab order of the criteria will be renumbered at intervals of 10. |
| Column Name | The unique criteria column name (20 characters or less). |
| Report Group | The report group that conforms to this criteria. |
| Label Style | Override the default label style by either a CssClass starting with a ‘.’ or the actual style content |
| Content Style | Override the default label style by either a CssClass starting with a ‘.’ or the actual style content |
| Default Value | Enter a Client Side default value in JavaScript; you may use function such as CurrentDate() for today’s date etc.Date constant in ‘YYYY.MM.DD’ format. |
| Permission Table | The permission key columns on this table that will be used to set restrictions on this criterion. |
| Table Abbreviation | Use "a" if permission column exists in the above permission table, otherwise enter any letter being used as table reference in the _Get?? sp. |
| Require Validation | When checked, this criterion becomes mandatory. |
| Data Type | The data type for this report criteria column. |
| Data Type Size | The data type size in pixels for this criteria column. This is relevant only for non-standard data types such as char, varchar, etc. |
| Display Mode | The display mode for this report criteria column.
Special case for multi-select non-mandatory listbox when the top empty row is included in the selection:
|
| Column Size (px) | The column size in pixels for this criteria column. |
| List Row Size | This specifies the number of rows only if this criterion is a ListBox. |
| Dropdown Key Column | The column name for the key column of this Dropdown, ListBox, or ComboBox. |
| Dropdown Ref Column | The column name for the display column of this Dropdown, ListBox, or ComboBox. |
| Dropdown Sort Column | When this column name is not specified, the reference column above will be used for sorting. |
Fields Info
| Column | Description |
|---|---|
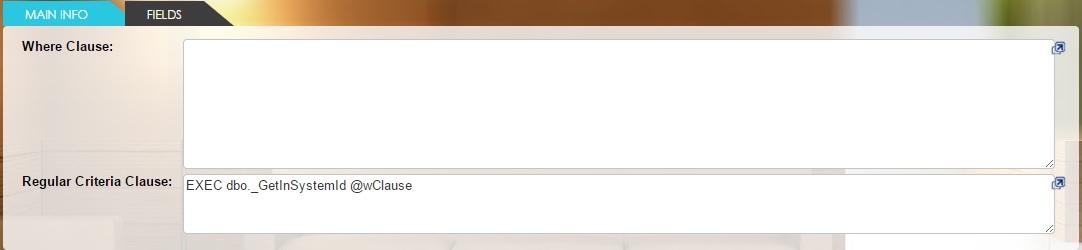
| Where Clause | The additional condition required for this criterion. If this is empty the @wClause being passed to the reporting Stored Procedure described below would become: ‘WHERE 1=1’; The syntax to overwrite this would be become:SELECT @wClause = 'WHERE a.Priority <> 0'. |
| Regular Criteria Clause | When empty this is automatically filled and the Stored Procedure created when the Save-button is clicked for a Dropdown, ListBox, RadioButton or ComboBox. The developer may choose to overwrite this using another Stored Procedure name for the desired display. It is recommended that the Stored Procedure name of the criteria column name begin with the prefix “_GetIn”. |
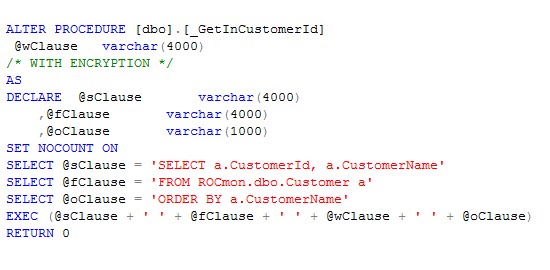
An example of a Stored Procedure to obtain a list for Dropdown, ListBox, RadioButton, or ComboBox is as follows:
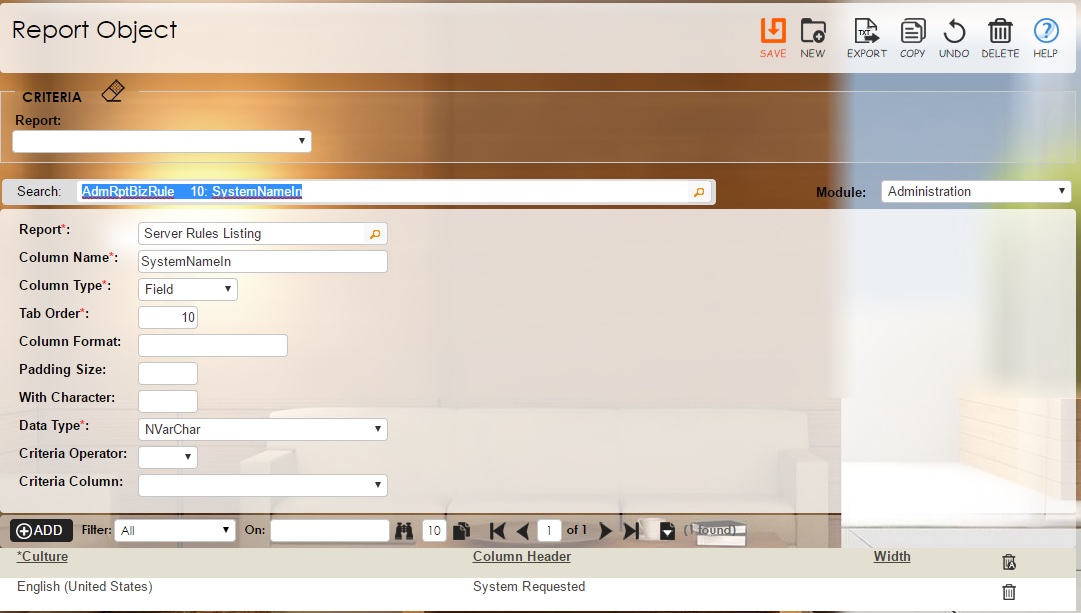
Report Object
The columns to be returned by the report Stored Procedure described in the Regular Field Clause and/or described in the Report Definition should match the columns described here.
Command: Client Tier -> Report -> Advanced Report -> Report Columns
| Column | Description |
|---|---|
| Report | The report that this column belongs to. |
| Column Name | The unique column name to be referenced in the Select Clause. |
| Column Type | The report column type for this report column. Currently either “Field” or “Parameter”. |
| Tab Order | The tab order of this report column with respect to other columns. When a number is entered, all tab order of the criteria for the same report will be renumbered at intervals of 10. |
| Column Format | This is an optional column format for the display of this column. e.g. MMMM d, yyyy specifies the long date format. |
| Padding Size | The total number of characters so that this column can be right-aligned with specified padding characters to the left. |
| With Character | The character to be padded to the left of this column if the total padding size has been specified. Default is blank. |
| Data Type | The data type for this report column. Detailed choices can be obtained from Volume 2. |
| Criteria Operator | The operator to match to a report criteria, if appropriate. If assigned, the @wClause will automatically populate with the formula below. |
| Criteria Column | The criteria column to match to the above column (Criteria Operator), if appropriate. |
Layout and Format
The final step in Rintagi reporting is to define the layout and format for each of the columns specified. They can be divided into four categories:
1.  Crystal Reporting,
2.  Excel Reporting Only,
3.  Document merging,
4.  Report Generator (excluding document merging).
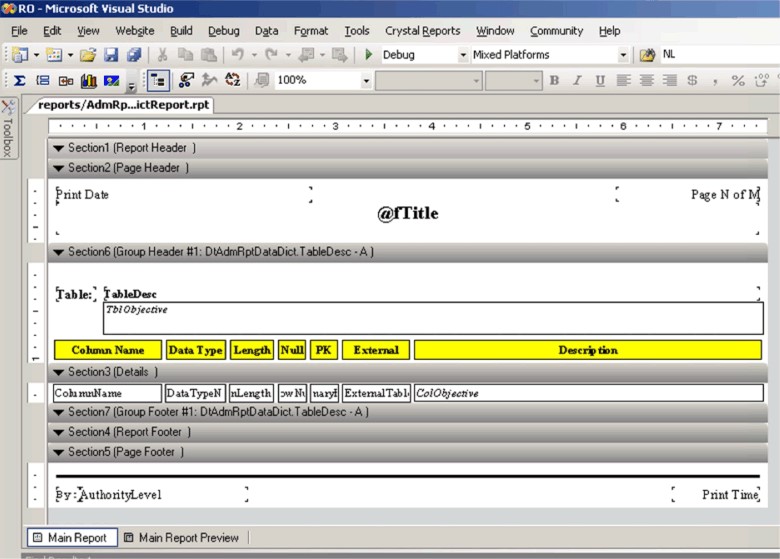
Crystal Reporting
The current version of Rintagi expects a Crystal Report (.rpt) with the same name as the report name. Using Visual Studio and Crystal Report designer, the result set from the report Stored Procedure is identified and the layout and format can then be done following the procedures provided by those tools.
Excel Reporting Only
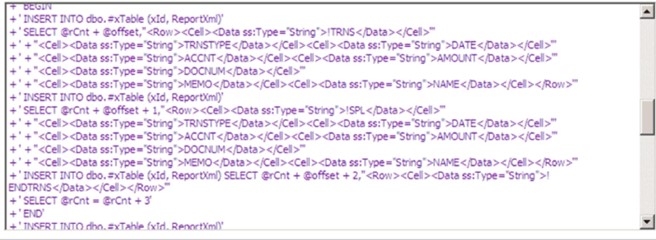
This exports a report as a formatted Excel spreadsheet. The result set returned by the report Stored Procedure is expected to be XML-based. The report must be interpreted by Excel 2002 or a later version. For example:
Document Merging
Rintagi provides maximum flexibility in document merging. Each column that needs to be merged can be enclosed by double square brackets “[[“and”]]”. For example:
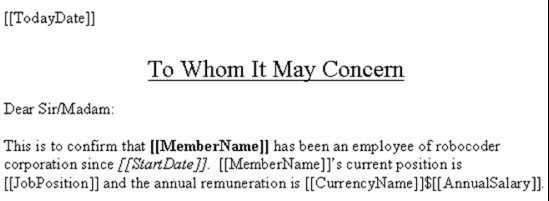
The above is a business letter properly formatted with the appropriate font, (bold, italic, etc.). The column names enclosed in double brackets will be replaced by the result set returned from the report Stored Procedure. The same merge technique applies to flat text files.
Report Generator
Report Generator items (excluding document merging) are powered by Microsoft SQL Reporting Service. To effectively format and layout the report columns, five interfaces are provided to replace the time-consuming, hand-coding effort in changing the .rdl XML file directly. If desired, native SQL Report Designer can be used to modify the .rdl file directly outside of Rintagi. Warning: clicking the Save Button when prompted and answering yes in Report Generator will overwrite the .rdl file.
The five interfaces are:
1.  Report Control
2.  Report Element
3.  Report Chart
4.  Report Table
5.  Report Style
In order to understand how the above advanced interfaces work, consult the Microsoft SQL Reporting Service manual.
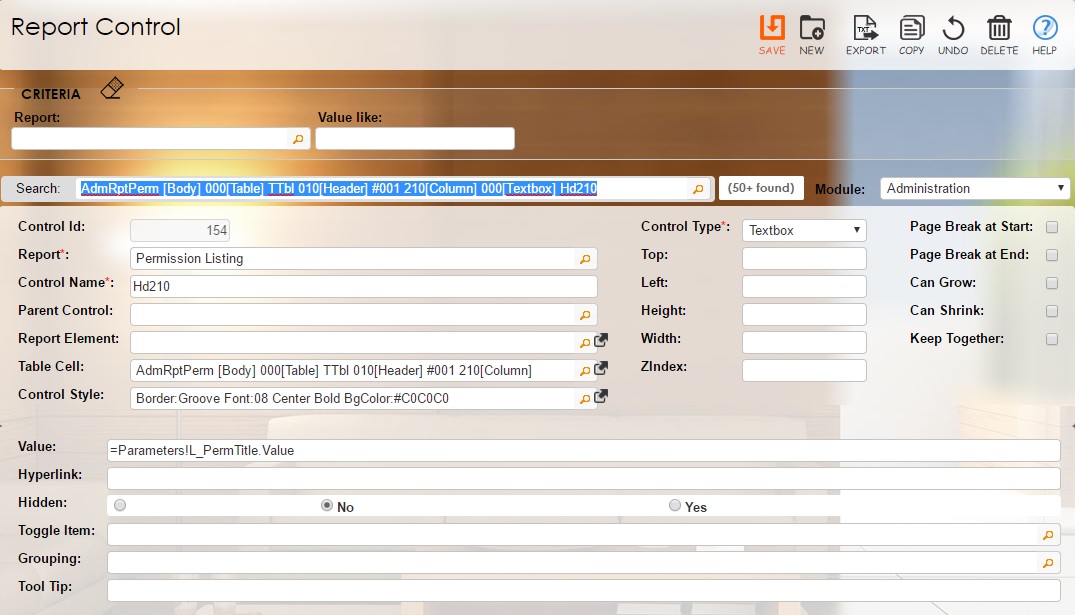
Report Control
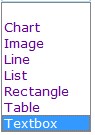
This is essentially the same as “Report Item” in SQL Reporting Service. It is automatically populated by the Report Generator but can be changed, as necessary. The list of controls from which to select is:
Command: Client Tier -> Report -> Advanced Report -> Report Control
| Column | Description |
|---|---|
| Control Id | This internal ID uniquely identifies this report control. |
| Report | The report this control belongs to. |
| Control Name | This description uniquely represents this report control. |
| Parent Control | The parent report control of this control, if applicable. |
| Report Element | The report element this control belongs to, if applicable. |
| Table Cell | The table cell this control refers to, if applicable. |
| Control Style | The style sheet of this report control, if applicable. |
| Control Type | The report control type as described above. |
| Top | The relative top position of this report control, if applicable. |
| Left | The relative left position of this report control, if applicable. |
| Height | Height of this report control, if applicable. |
| Width | Width of this report control, if applicable. |
| Z-Index | This represents the relative depth of this report control, if applicable. |
| Page Break at Start | This forces a page break at the beginning of the rectangle. |
| Page Break at End | This forces a page break at the end of the rectangle. |
| Can Grow | This allows the Textbox to increase in size in order to accommodate the contents. |
| Can Shrink | This allows the Textbox to decrease in size in order to match the contents. |
| Keep Together | This keeps the entire data region (all repeated sections) together on one page, if possible. |
| Value | This expression or constant is the value to be displayed in the Textbox. |
| Hyperlink | This is value for the hyperlink action |
| Hidden | This is the initial table visibility and this item is hidden when checked |
| Toggle Item | This is the textbox control for the toggle of this item visibility |
| Grouping | This is field for the grouping of data |
| Tool Tip | This is the textual label as a tool tip for this report control |
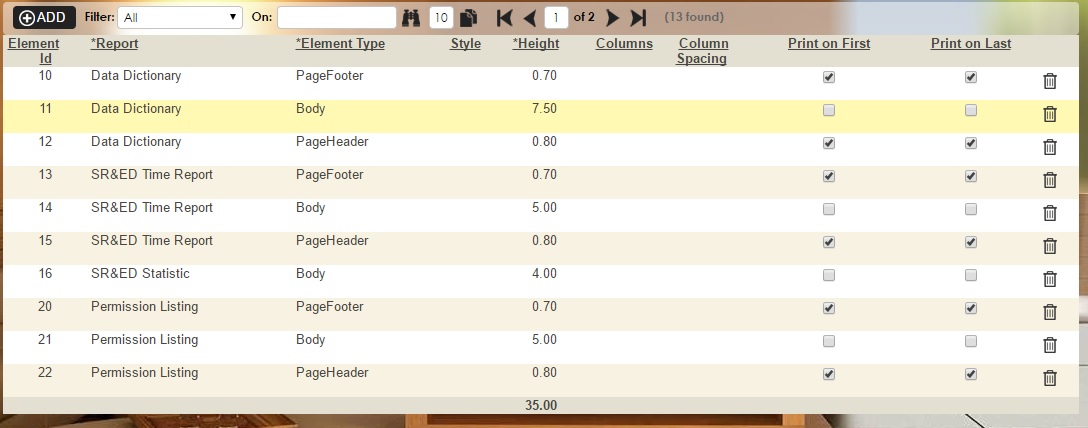
Report Element
The Report Element defines the body, page header, and page footer. The Report Generator automatically populates this but it can be changed as necessary.
Command: Client Tier -> Report -> Advanced Report -> Report Element
| Column | Description |
|---|---|
| Report | The report this element belongs to. |
| Element Type | The type of this element. Select from “Body”, “Page Header” and “Page Footer”. |
| Element Style | The style sheet for this report element. |
| Element Height | Height of this report element. |
| Number of Columns | The number of columns for this report body (default 1). |
| Column Spacing | The spacing between each column in a multi-column output (default 0.5 in.), if applicable. |
| Print on First | This refers to the header/footer and indicates if it should be shown on the first page of the report. |
| Print on Last | This refers to the header/footer and indicates if it should be shown on the last page of the report. |
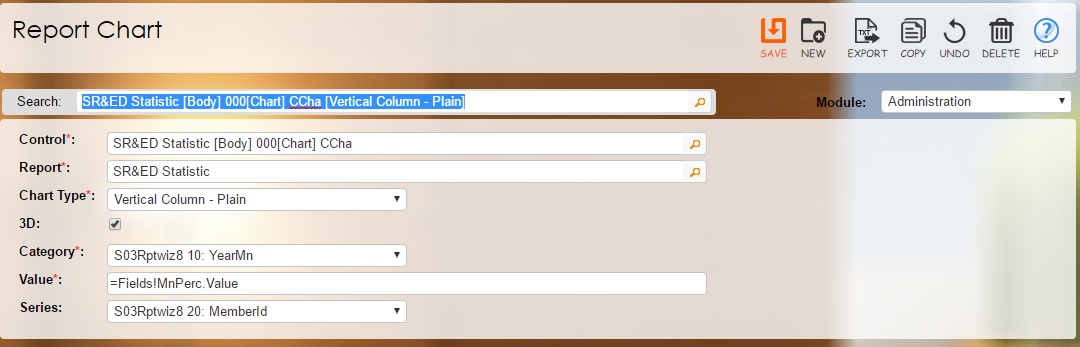
Report Chart
This is only relevant if there is a chart defined in the Report Generator and that chart is automatically populated.
Command: Client Tier -> Report -> Advanced Report -> Report Chart
| Column | Description |
|---|---|
| Control | The report control this chart refers to. |
| Report | The report this chart belongs. |
| Chart Type | The report chart type as described in the Report Generator above. |
| 3D | Check when the chart is to be displayed in 3D, (default is 2D). |
| Category | The field for the grouping of data by category. |
| Value | This expression or scalar is the value which is displayed as plot data value. |
| Series | The field for the grouping of data by series, if applicable. |
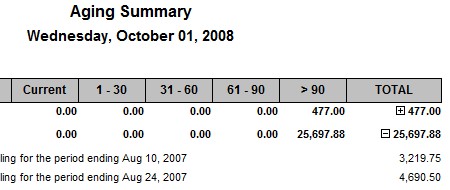
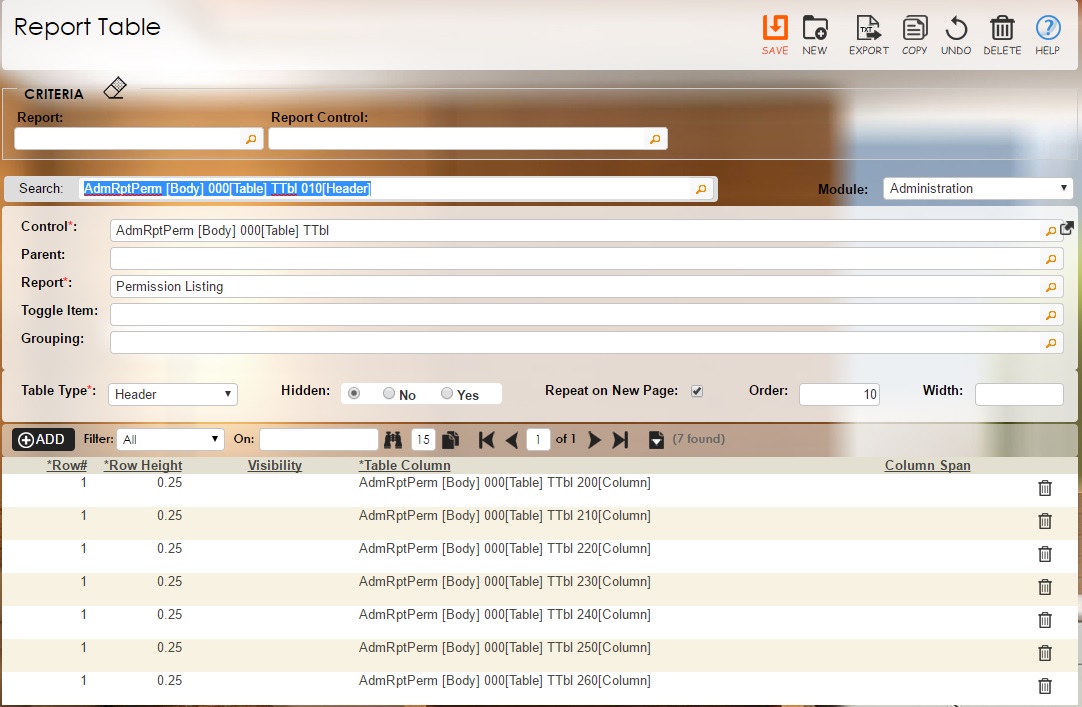
Report Table
This contains the definition for a summary table and is populated by the Report Generator. The example below demonstrates a drill-down feature that functions by simply hiding the detail control and toggling for the information by using the “+” and “-” keys.
Command: Client Tier -> Report -> Advanced Report -> Report Table
| Column | Description |
|---|---|
| Control | The report control this table refers to. |
| Parent | The parent report table of this table, if applicable. |
| Report | The report this table belongs to. |
| Table Type | The report table type. Selections are “Column”, “Detail”, “Header”, “Group” and “Footer”. |
| Toggle Item | This is the textbox control for the toggle of table visibility |
| Grouping | The field for the grouping of data. |
| Hidden | This is the initial table visibility and the item is hidden when checked |
| Repeat on New Page | Indicates if this header/footer should be displayed on every page on which the table (or group) is displayed. |
| Order | This number indicates the relative order of the table columns. (Default is intervals of 10). |
| Width | Width of the table column. |
| Row # | The relative row this table cell belongs to. |
| Row Height | Height of this table row/cell. |
| Row Visibility | The XML element and expression for the visibility of this row/cell, if applicable. |
| Table Column | The table column this cell belongs. |
| Column Span | The number of columns this cell spans. (Default is 1). |
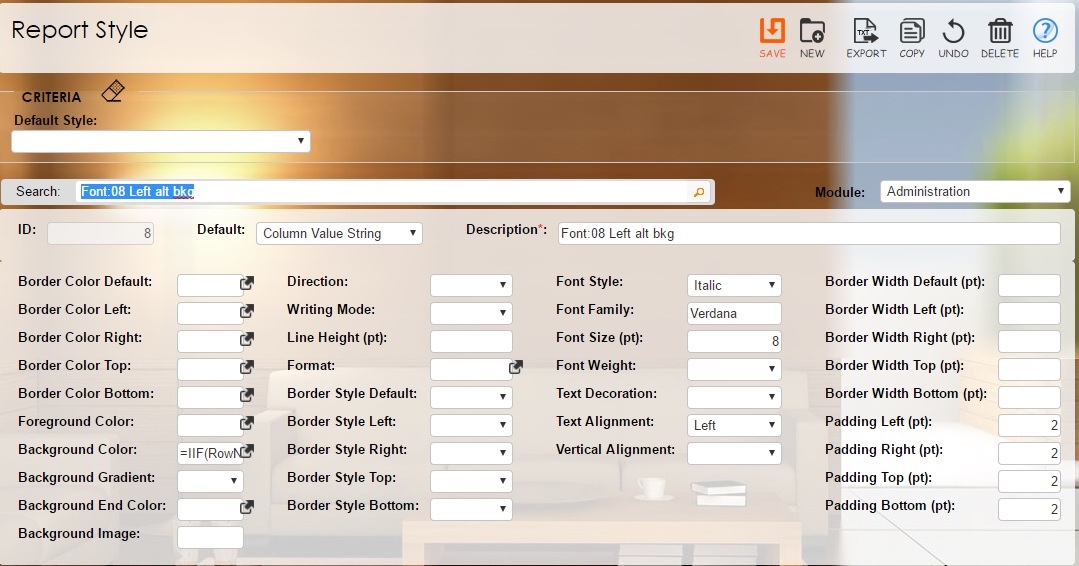
Report Style
This set of default styles has been created to be modified for use by all of the SQL reports. Custom graphics choices can create reports that match corporate identity or user style. Additional styles can be constructed and named to be used by various controls. Developers may click the ![]() icon to popup a selection of color coded styles.
icon to popup a selection of color coded styles.
Command: Client Tier -> Report -> Advanced Report -> Report Style
| Column | Description |
|---|---|
| Style Id | This internal identity uniquely represents this report style. |
| Default | Used internally by the reporting wizard to identify the default style for various report items. |
| Description | Unique description representing this report style. |
| Border Color Default | The default color name or RGB color code in the form #HHHHHH for all the borders. |
| Border Color Left | The color name or RGB color code in the form #HHHHHH for the left border. |
| Border Color Right | The color name or RGB color code in the form #HHHHHH for the right border. |
| Border Color Top | The color name or RGB color code in the form #HHHHHH for the top border. |
| Border Color Bottom | The color name or RGB color code in the form #HHHHHH for the bottom border. |
| Foreground Color | The color name or RGB color code in the form #HHHHHH for the foreground. |
| Background Color | The color name or RGB color code in the form #HHHHHH for the background. |
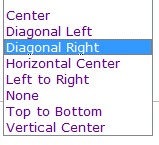
| Background Gradient | The background gradient type for the report. Indicates the direction in which the gradient is applied. The choices are:
|
| Background End Color | The color name or RGB color code in the form #HHHHHH for the background gradient end color. |
| Background Image | The external background image file with an absolute or relative path. |
| Line Height | Height of a line of text (from 1 pt to 1000 pt). |
| Format String | The .NET formatting string or code i.e. “C” for currency. |
| Border Style Default | Default border style. |
| Border Style Left | Left side border style. |
| Border Style Right | Right side border style. |
| Border Style Top | Top side border style. |
| Border Style Bottom | Bottom side border style. |
| Font Style | Style of the selected font. |
| Font Family | The font family. Default is Arial. |
| Font Size | The font size (from 1 pt to 200 pt). Default is 10 pt. |
| Font Weight | The thickness of the font in pts. |
| Text Decoration | The text decoration. |
| Text Alignment | The horizontal alignment of the text. |
| Text Decoration | The text decoration. |
| Vertical Alignment | The vertical alignment of the text. |
| Border Width Default (pt.) | The default width for the border (from 1 pt to 20 pt). |
| Border Width Left (pt.) | The width for the left border (from 1 pt to 20 pt). |
| Border Width Right (pt.) | The width for the right border (from 1 pt to 20 pt). |
| Border Width Top (pt.) | The width for the top border (from 1 pt to 20 pt). |
| Border Width Bottom (pt) | Width for the bottom border from 1 pt to 20 pt. |
| Padding Left (pt) | The padding between the left edge of the item and its content from 0 pt to 1000 pt. |
| Padding Right (pt) | The padding between the right edge of the item and its content from 0 pt to 1000 pt. |
| Padding Top (pt) | The padding between the top edge of the item and its content from 0 pt to 1000 pt. |
| Padding Bottom (pt) | The padding between the bottom edge of the item and its content from 0pt to 1000pt. |
| Direction | The text direction for different cultures. Select between “Left to Right” and “Right to Left”. (Default is “Left to Right”.) |
| Writing Mode | The writing mode in either horizontal or vertical. |
Report Template
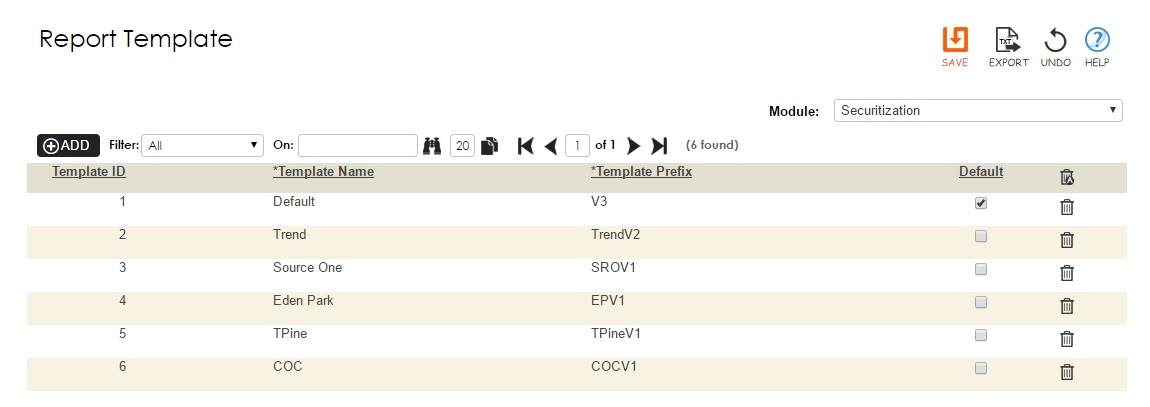
Specification
The http command line to invoke a report should look like the following: SqlReport.aspx?csy=5&msy=1&typ=N&rpt=5&key=2&act=Y&gen=Y Where:
•   Mandatory: “csy” stands for “current system id” found
               in system table “Systems”;
•   “msy” stands for “menu system id” found in system table “Systems”;
•   “typ=N” strips all navigation on pop up;
•   “key” is the “memorized criteria id” found in system table “RptMemCri”;
•   “act=Y” runs the report immediately; “act=N” prompts for criteria;
•   “gen=Y” runs report generator’s report; “gen=N” runs developer’s report;
Chapter 4
Rule Tier
Reporting Business Rules are designed to reside in Stored Procedures to maximize flexibility and efficiency. Most, if not all of the business rules used to extract the appropriate information from the databases will be contained in these Stored Procedures. More Stored Procedures can be created, as necessary, to be called by these Stored Procedures. These stored-procedures are called in the Regular Field Clause of the Report Definition.
Parameters
Except for @wClause which must be present, a developer may choose to use any combination of the following five systems-provided parameters together with those criteria parameters defined by the developer in the client tier as previously described in chapter 3.
| Parameter | Data Type | Description |
|---|---|---|
| @Usrs | varchar(1000) | Advanced: A list of the current login user id, (UsrId) followed by the impersonated UsrId, if any, delimited by CHAR (191). |
| @RowAuthoritys | varchar(1000) | Advanced: A list of the current login row authority id, followed by the impersonated row authority id, if any, delimited by CHAR (191). |
| @UsrId | int | The user id of the current login. |
| @usrName | nvarchar(50) | The user name of the current login user. |
| @currCompanyId | smallint | The current company id. |
| @wClause | varchar(4000) | The simplest form of this is “WHERE 1=1” but it may also contain special filter rules as defined in the client tier. |
Result Set
The result set returned by the reporting Stored Procedure may include a combination of the following system-reserved columns:
| Schema Characteristic | Description |
|---|---|
| AuthorityLevel | Often used to display the user name of the current login user. |
| ReportName | The default name of the report to be saved when exporting to a tab-delimited flat file, Excel spreadsheet, PDF, DOC, or RTF. |
| TemplateId | Advanced: Used when different templates need to be implemented for each row of data returned for RTF and TXT document merging and printing. (As described in previous chapters). |
Other columns returned in the result set of the reporting Stored Procedure should be specified in the Client Tier (as previously discussed). It is recommended that all of the business rules, including computations and permutations should be designated in the reporting Stored Procedure so that the result set produced represents the complete blueprint of the requirements. Once this blueprint is complete only layout and formatting remain. Wherever possible, dynamic SQL should be used to maximize flexibility.